Analytics
Income, expenses, profit and trends by day, week, month or year — with filters for any slice.
Step by step
Open Analytics
The cards show income, expense, net profit and how many transactions are in view.
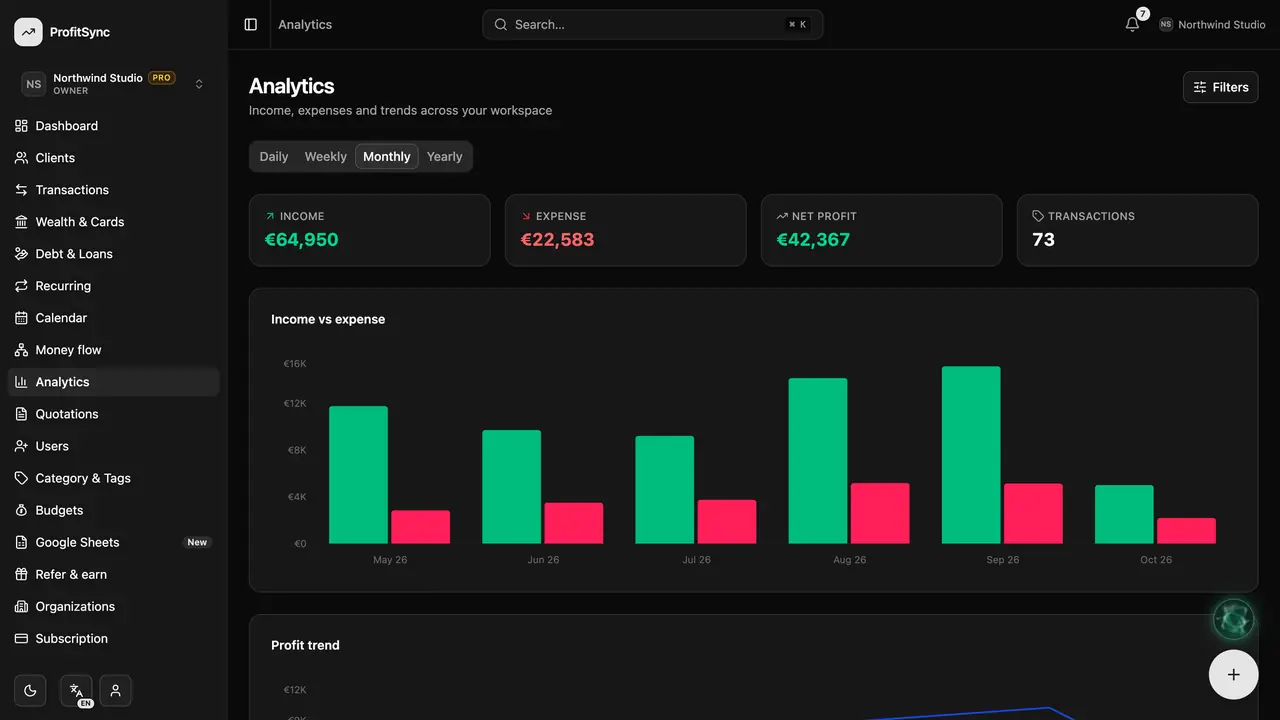
Pick a period
Choose Daily, Weekly, Monthly or Yearly to change how the charts group your money.
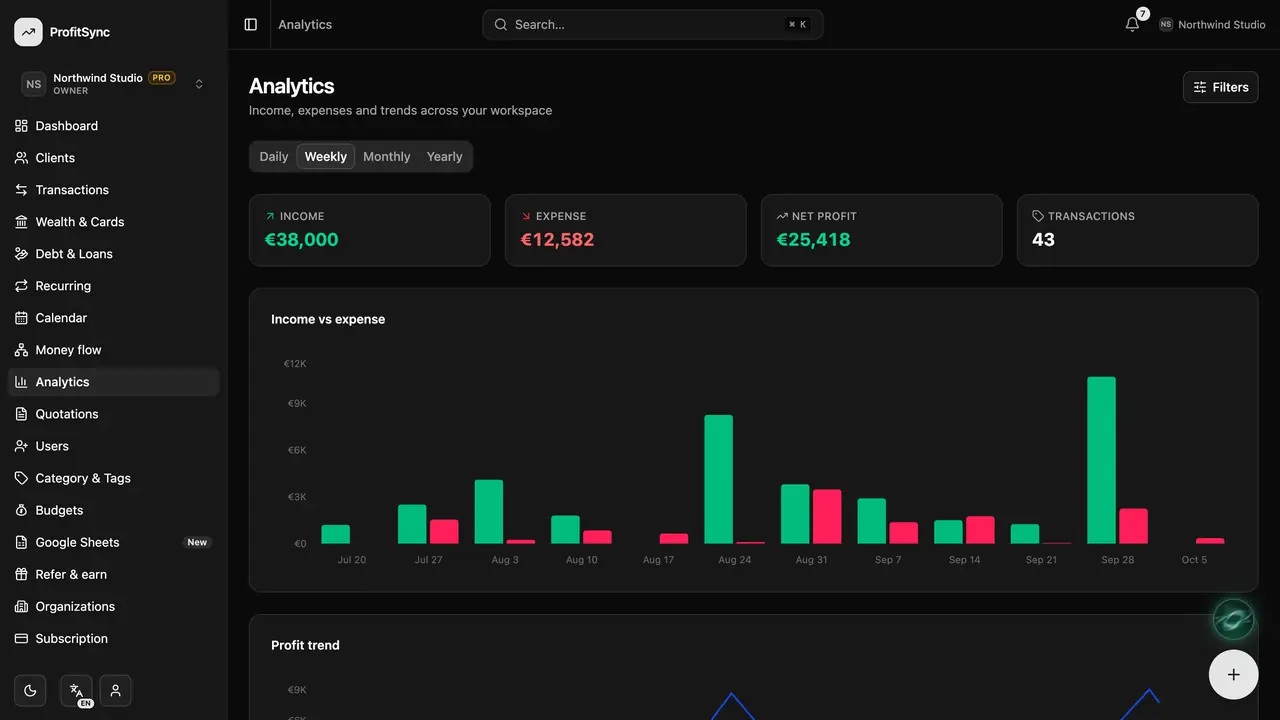
Read the charts
Compare income with expenses, follow your profit trend and see which categories and clients matter most.
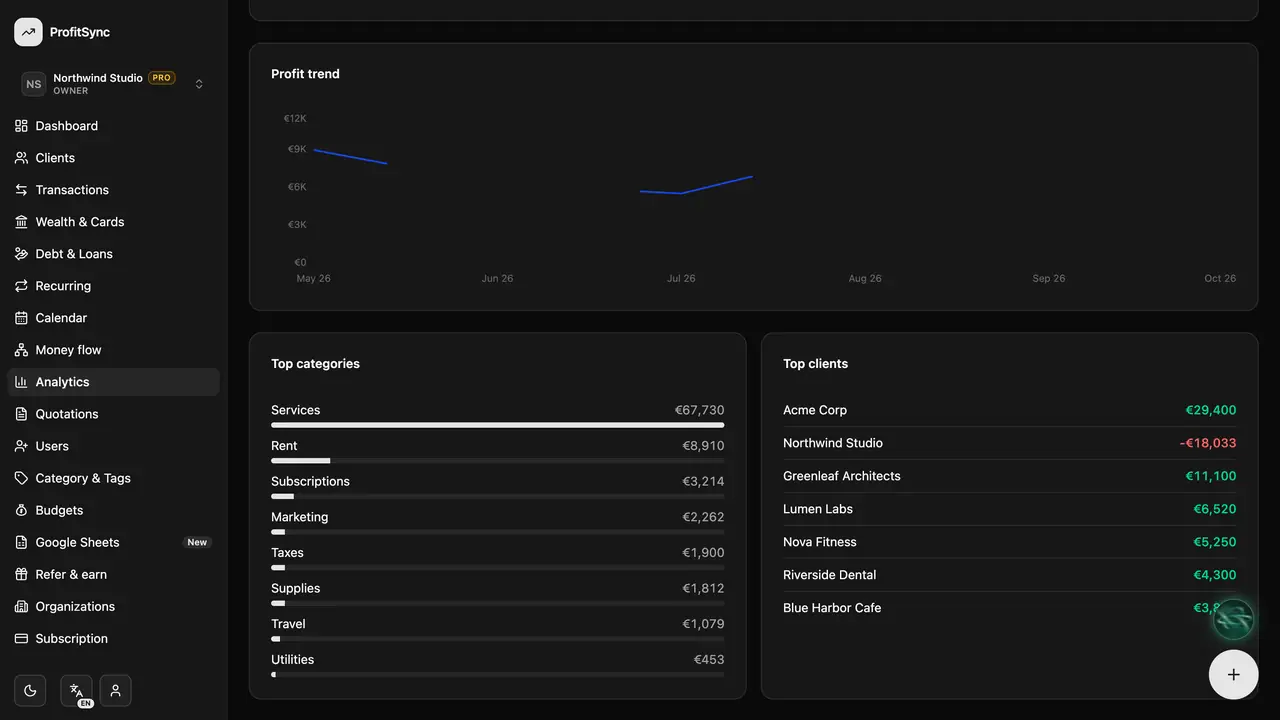
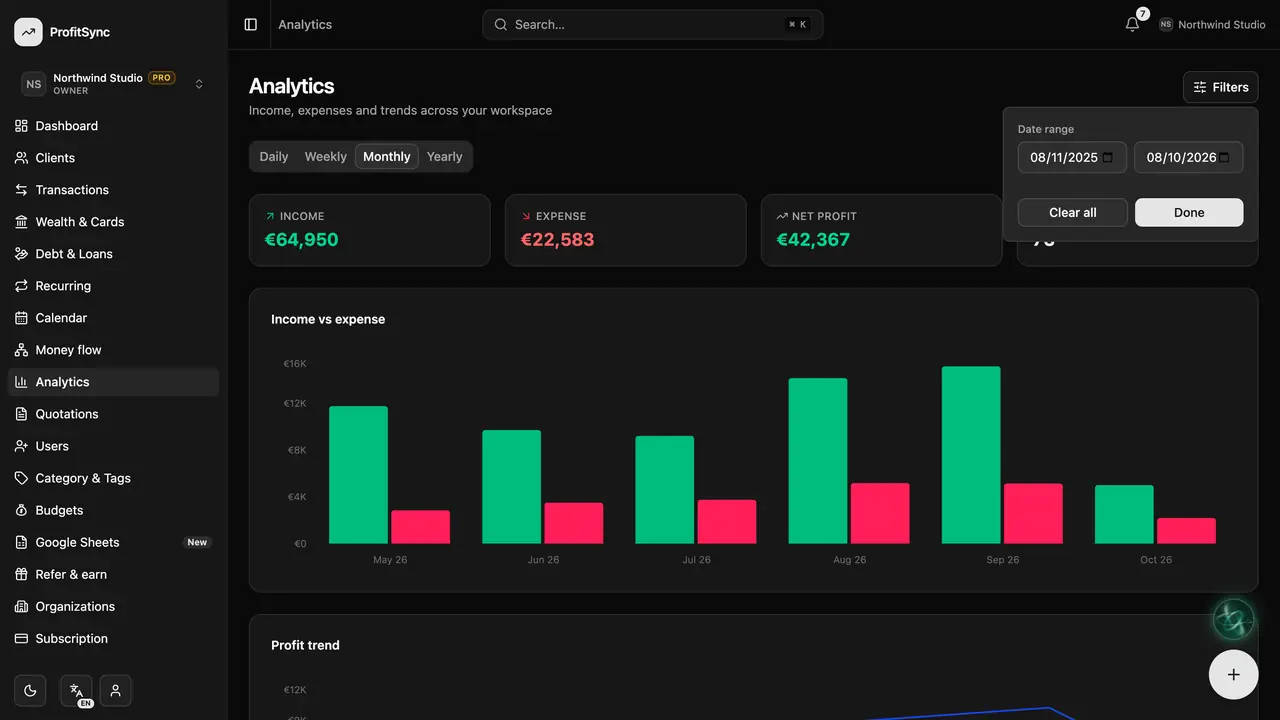
Filter the view
Click Filters to narrow everything to certain dates, clients, categories or accounts.
Good to know
- Transfers between your own accounts never appear as income or expense here.
- Refunds reduce your expenses instead of counting as income.
Related guides
Write to us and a real person will reply. Contact support